
How to Create a Thermal Camera Effect with AI — Magic Eraser
Learn how to create a thermal camera effect with AI from a regular photo. This guide covers false-color heat maps, Ironbow and Rainbow palettes, sensor artifacts, heat-source cues, and why simulated thermal images are visual effects rather than real temperature measurements.

Product Marketing
Reviewed by Magic Eraser Editorial ·
Table of Contents
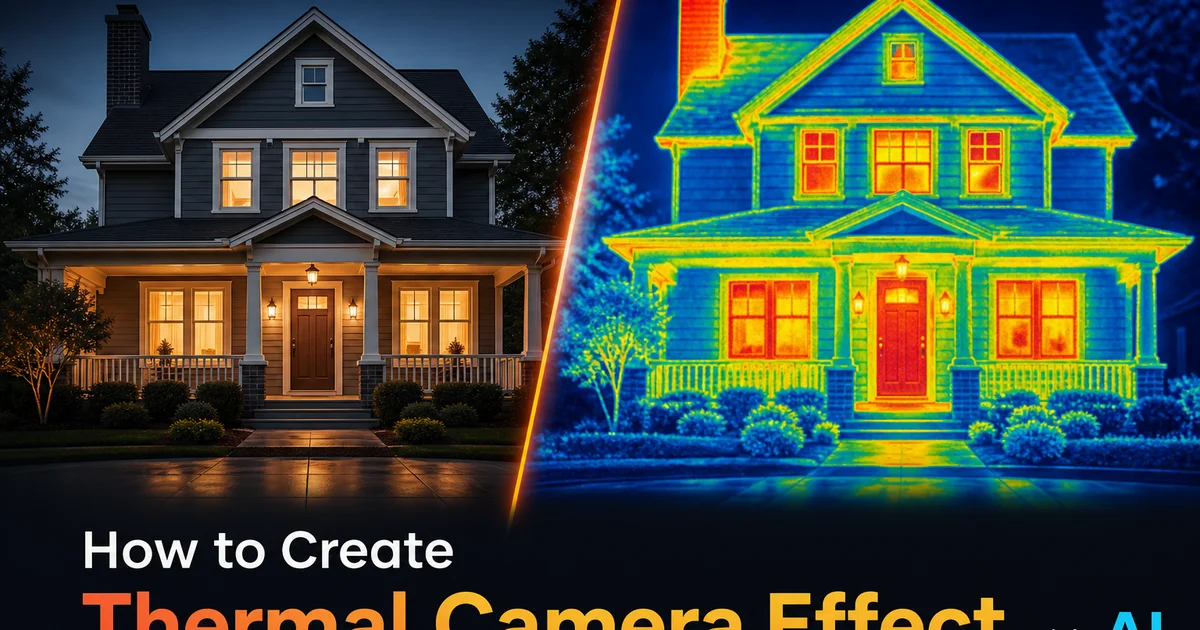
Thermal imaging cameras detect infrared radiation emitted by objects based on their temperature, converting invisible heat energy into visible images through false-color mapping. Every object above absolute zero emits infrared radiation proportional to its temperature. Thermal cameras capture this radiation through specialized sensor arrays that are sensitive to the mid-wave or long-wave infrared spectrum rather than the visible light spectrum that conventional cameras detect. The resulting thermal images reveal temperature distribution patterns invisible to the human eye. The heat signature of a person standing in a dark room, the thermal leaks around poorly insulated windows, the hot exhaust plume behind a running vehicle, the fever temperature on a patient's forehead. These images are displayed using false-color palettes that map temperature values to visible colors, creating the distinctive heat-map visualizations instantly distinct from security footage, building inspection reports, and science documentaries.
Actual thermal imaging cameras are specialized instruments that cost hundreds to thousands of dollars and capture infrared wavelengths that conventional camera sensors cannot detect. The false-color thermal images they produce look at its core different from visible-light photographs because they show temperature distribution rather than reflected light. Two objects that look identical in visible light can appear completely different in thermal imaging if they are at different temperatures, and objects that look different in visible light can appear identical in thermal imaging if they happen to be at the same temperature. This disconnect between visible look and thermal look is what makes thermal imaging both scientifically valuable and visually fascinating.
AI-powered thermal camera simulation creates convincing false-color thermal visualizations from ordinary photographs by analyzing the image content, identifying different materials and subject types, assigning plausible temperature values based on known thermal properties. Mapping those values through standard thermal color palettes. The AI recognizes that human skin is warm, metal reflects ambient temperature, glass transmits rather than reflects infrared, vegetation is cooler than surrounding pavement, and electronic devices generate heat. Applying these thermal rules to produce visualizations that are physically plausible rather than arbitrary color mappings. This guide covers how to use Magic Eraser to transform regular photographs into thermal camera-style visualizations with controls for color palette, temperature mapping, thermal resolution, and sensor artifact simulation. Treat the result as a creative or educational visual effect, not a real thermographic measurement for safety, medical, electrical, or building-inspection decisions.
- Thermal imaging converts invisible infrared radiation into visible false-color maps — AI simulates this by assigning plausible temperature values based on material identification in the photograph.
- Standard thermal palettes including Ironbow, Rainbow, White Hot, and Arctic each produce distinct visualization styles used in different professional and creative contexts.
- Material-aware temperature mapping assigns different thermal profiles to skin, metal, glass, vegetation, water, and sky based on their known real-world thermal behaviors.
- Thermal sensor artifacts including low-resolution softness, bloom effects, crosshair overlays, and scale legends add technical authenticity that distinguishes simulation from simple color remapping.
- Temperature range and thermal resolution controls determine the contrast between heat zones and the number of distinct temperature bands visible in the visualization.
How AI assigns plausible temperature values from visible-light photographs
The core technical challenge of thermal camera simulation is converting visible-light image information into plausible temperature distributions. A visible-light photograph contains color and brightness information about reflected light. It shows what objects look like, not what temperature they are. A white wall and a black wall at the same temperature look completely different in a photograph but would appear nearly identical in a real thermal image. Conversely, a running laptop and an identical powered-off laptop look the same in a photograph but would appear greatly different in thermal imaging. The AI must bridge this fundamental gap between visible look and thermal behavior by understanding what the objects in the image are rather than merely how they look.
The AI accomplishes this through semantic scene analysis that identifies the material type, object category. Likely thermal state of each region in the photograph. Human faces and exposed skin are mapped to body surface temperature around 34 to 36 degrees Celsius, with slight variations. The nose and ears are slightly cooler due to lower blood flow, the forehead and neck are slightly warmer. Clothing is mapped to a temperature between body heat and ambient because fabric insulates but allows some heat transmission. Electronic devices, vehicles with running engines, and kitchen appliances receive elevated temperature values. Vegetation maps to a cooler thermal profile due to transpiration cooling. Glass surfaces are handled specially because glass is opaque to most infrared wavelengths, meaning thermal cameras see the glass temperature rather than objects behind it. A major difference from visible-light behavior where glass is transparent.
The plausibility of the temperature mapping is what separates convincing thermal simulation from simple color remapping. Arbitrary false-color application — remapping image brightness to a thermal palette — produces results that look superficially thermal but contain physical impossibilities like cold human faces and hot sky regions. The AI's material-aware approach produces images where the thermal patterns match what a real thermal camera would plausibly capture: people are warm against cool backgrounds, sunlit pavement is warmer than shaded pavement, metal surfaces reflect thermal patterns from nearby heat sources. The sky reads as very cold because the atmosphere emits minimal infrared radiation compared to terrestrial objects. These physically grounded temperature assignments create the convincing thermal realism that makes the effect visually strong and educationally useful.
- Visible-light photos show reflected light rather than temperature — AI bridges this gap by identifying what objects are rather than merely how they look.
- Human skin maps to 34-36 degrees Celsius with anatomical variation — nose and ears slightly cooler, forehead and neck warmer due to blood flow distribution.
- Glass is handled as infrared-opaque, showing its own temperature rather than objects behind it — matching real thermal camera behavior where windows appear as solid thermal surfaces.
- Physically grounded temperature assignments prevent the impossibilities of simple color remapping like cold faces and hot sky regions.
Thermal color palettes and their professional contexts
The Ironbow palette is the most widely recognized thermal imaging color scheme and the default choice for general-purpose thermal simulation. It maps the coldest temperatures to black, progresses through deep blue and purple for cool regions, transitions through red and orange for warm zones, reaches bright yellow for hot areas. Peaks at white for the highest temperatures. This palette provides excellent perceptual contrast between temperature zones because it uses both hue and brightness changes to differentiate temperatures. Cold regions are both blue and dark while hot regions are both yellow and bright. The Ironbow palette is standard in building inspection, electrical maintenance. Industrial thermography because its intuitive cold-to-hot color progression makes temperature patterns right away readable without reference to a color scale legend.
The Rainbow palette uses the full visible color spectrum to maximize the number of perceptually distinct temperature zones visible in a single image. The coldest temperatures map to violet and blue, intermediate temperatures progress through green and yellow, and the hottest temperatures reach red. This palette provides the highest color differentiation. A viewer can distinguish more distinct temperature levels in a Rainbow thermal image than in any other standard palette — but it sacrifices the intuitive warm-cool association of the Ironbow palette because green, which appears in the middle temperature range, does not intuitively read as a temperature between blue-cold and red-hot. Rainbow is common in scientific and medical thermography where maximum temperature discrimination matters more than intuitive readability.
The White Hot and Black Hot palettes map temperature to a simple grayscale range and are associated with military, surveillance, and law enforcement thermal imaging. White Hot maps increasing temperature to increasing brightness. Cold objects appear dark, warm objects appear bright, and the hottest objects glow white — producing the distinctive look familiar from helicopter pursuit footage and military night vision records. Black Hot reverses this mapping so that warm objects appear dark against bright cool backgrounds. Some operators find easier to interpret for target spotting against uniform thermal backgrounds. The Arctic palette uses a blue-to-white color range that emphasizes cold temperature differentiation and is aesthetically suited to winter scenes, HVAC analysis visualizations. Cold-chain monitoring content where the emphasis is on cold-zone spotting rather than heat detection.
- Ironbow progresses from black through blue, red, yellow to white — standard for building inspection and industrial thermography because its warm-cool progression is immediately intuitive.
- Rainbow maximizes distinct temperature zones across the full visible spectrum but sacrifices intuitive warm-cool association in mid-range green regions.
- White Hot grayscale mapping creates the surveillance and military thermal look where warm objects glow bright against dark cool backgrounds.
- Arctic blue-to-white palette emphasizes cold temperature differentiation for winter scenes, HVAC content, and cold-chain monitoring visualizations.
Thermal sensor artifacts and technical authenticity
Real thermal cameras produce images with distinctive visual traits that differ markedly from visible-light photography. Mimicking these traits adds technical realism that makes the thermal effect convincing rather than appearing as a simple color filter. The most prominent trait is lower spatial resolution. Thermal sensor arrays often have far fewer pixels than visible-light sensors, with common thermal cameras operating at 160x120, 320x240, or 640x480 pixels compared to the multi-megapixel resolution of phone cameras. This produces images with softer edges, less fine detail. A slightly blocky character that is right away distinct as thermal imagery. The AI mimics this by reducing effective resolution and applying the trait softness of infrared optics which have different diffraction properties than visible-light lenses.
Thermal bloom is an artifact where very hot objects appear to radiate heat visually into adjacent cooler regions, creating a glowing halo effect around high-temperature sources. In real thermal cameras, this occurs due to a combination of optical diffraction in the infrared wavelengths, sensor pixel crosstalk where signal from saturated hot pixels bleeds into neighbors. Mood scattering of infrared radiation near intense heat sources. The effect is most visible around people's heads against cold outdoor backgrounds, around exhaust pipes and engine components. Around any localized heat source that is greatly warmer than its surroundings. The AI bloom simulation creates this spreading warm glow around identified hot regions, adding the trait thermal halo that makes high-temperature sources appear to radiate visible warmth into their setting.
Technical overlay elements complete the thermal camera simulation for applications where technical realism matters. The crosshair reticle with a digital temperature readout shows a specific temperature value at the center point or at a user-selected location. The color scale legend bar displayed along one edge of the image maps the palette colors to a temperature range, allowing the viewer to read approximate temperatures from any region of the image. Frame information overlays including date, time, emissivity setting. Camera model designation add the data-stamp look of expert thermal imaging equipment. These overlays can be one by one enabled or disabled. Creative applications often omit them for a cleaner aesthetic, while educational, demonstration, and social media content often includes them for maximum visual impact and authentic technical look.
- Lower spatial resolution simulation replicates the 320x240 characteristic softness of infrared sensor arrays that operates at far fewer pixels than visible-light cameras.
- Thermal bloom creates glowing halos around hot objects due to simulated optical diffraction, pixel crosstalk, and atmospheric infrared scattering near intense heat sources.
- Crosshair reticle with digital temperature readout and color scale legend add the data overlay appearance of professional thermal imaging equipment.
- Technical overlays are individually toggleable — creative applications omit them for clean aesthetics while educational content includes them for authentic appearance.
Creative and educational applications of thermal camera simulation
Social media content creation represents the most popular creative application of thermal camera simulation. The thermal aesthetic is right away attention-grabbing in social feeds because the false-color mapping transforms familiar subjects into alien-looking visualizations that stop the scroll. Portrait photos converted to thermal display reveal the warm signature of the face glowing against cooler clothing and background in a way that feels at once scientific and artistic. Content creators use thermal effects for music video stills, podcast cover art, gaming content thumbnails, and creative photography series. The effect works mainly well for fitness and athletic content where the thermal visualization of a body in motion. Warm active muscles, cool ambient air — adds a dynamic, energetic quality that standard photography cannot achieve.
Educational content benefits from thermal simulation as a teaching tool that illustrates infrared radiation and heat transfer principles without requiring actual thermal imaging equipment. Science educators can show how insulation works by showing thermal images of buildings with different insulation qualities, how body temperature regulation varies across different anatomical regions, how heat engines and mechanical systems distribute thermal energy. How thermal differences in landscapes reveal underground water sources or geological features. The simulated thermal images are not scientifically precise measurements. They are physically plausible demonstrations of thermal principles that make abstract concepts visually concrete for students and general audiences.
Marketing and advertising applications leverage the thermal aesthetic for its associations with advanced technology, scientific precision, and futuristic imagery. Security companies, HVAC contractors, insulation manufacturers, and building inspection services use thermal-style imagery to share their technical capabilities even in marketing materials where actual thermal images may not be available or may be too technically dense for a general audience. The thermal camera aesthetic right away shares that the business works with temperature, energy, heat, or detection technology. Tech companies, automotive brands, and sportswear manufacturers use thermal effects to position products as high-performance and technically advanced, tapping into the visual association between thermal imaging and cutting-edge technology.
- Social media thermal effects stop the scroll by transforming familiar subjects into alien-looking false-color visualizations with immediate visual impact.
- Educational content uses thermal simulation to illustrate insulation, body temperature, heat transfer, and thermal landscape principles without requiring actual equipment.
- Security, HVAC, and building inspection businesses use thermal aesthetics in marketing to communicate technical capabilities to general audiences.
- Fitness and athletic content benefits from thermal visualization of warm active muscles against cool ambient air, adding dynamic energy to standard photography.
How to do it
- 1
Upload the photo and evaluate subject matter for thermal simulation
Open your image in Magic Eraser and assess whether the photograph's subject matter will produce a convincing and visually interesting thermal camera simulation. Images containing people, animals, vehicles, buildings, and outdoor scenes with mixed materials work best because the AI can assign plausible temperature values based on the known thermal properties of each subject type. Portraits and group photos produce dramatic results because human body heat creates vivid warm signatures against cooler backgrounds. Avoid images composed fully of a single material type at uniform temperature, as these produce flat single-color results without the thermal contrast that makes the effect visually strong.
- 2
Select the thermal color palette for the target visualization style
Choose from standard thermal imaging color palettes that map temperature values to specific color ranges. The Ironbow palette maps from cool black and blue through warm red and yellow to hot white, producing the most commonly recognized thermal camera look. The Rainbow palette uses the full visible spectrum from violet through blue, green, yellow. Red for maximum color differentiation between temperature zones. The White Hot palette maps temperature to a grayscale range from black for cold to white for hot, mimicking military and surveillance thermal imaging. The Arctic palette uses blue-to-white mapping for a cold-focused aesthetic suitable for outdoor winter or HVAC-themed content.
- 3
Configure temperature zone mapping and heat source identification
Adjust how the AI assigns simulated temperature values to different regions of the photograph. The AI identifies material types and assigns plausible thermal profiles. Human skin maps to warm body temperature values, metal and glass map to ambient or reflected temperature, vegetation maps to cooler values with transpiration effects, and sky and water map to their respective thermal traits. Fine-tune the temperature range spread which controls the contrast between the warmest and coolest zones. Adjust the thermal resolution which determines how many distinct temperature bands are visible in the output.
- 4
Apply thermal imaging artifacts and sensor simulation effects
Enable optional thermal camera artifacts that add technical realism to the simulation. These include the trait low spatial resolution and soft edges of infrared sensor arrays which are lower resolution than visible-light cameras, the thermal crosshair reticle with temperature readout overlay, the color scale legend bar showing the temperature-to-color mapping. The slight thermal bloom effect where very hot objects bleed warmth into adjacent cooler regions. Each artifact can be one by one enabled or disabled depending on whether the goal is technical simulation accuracy or artistic thermal-inspired visual effect.
- 5
Export with appropriate metadata and format for the intended use
Export the thermal visualization at the resolution right for the intended context. For social media and creative content, export at standard digital resolutions with the selected color palette and optional artifacts. For educational or demonstration purposes, include the temperature scale legend and readout overlays. For artistic applications where the thermal color mapping is used purely for its visual impact, export without technical overlays for a cleaner aesthetic. The thermal effect can also be exported as a video-ready frame sequence for content creators producing thermal-themed video content from still photographs.
Sources
- Principles of Infrared Thermography and Thermal Imaging — FLIR Systems (Teledyne)
- False Color Mapping in Scientific Visualization — IEEE Transactions on Visualization
- Thermal Image Processing and Color Palette Standards — National Institute of Standards and Technology