
Edição de fotos com IA para fenologistas — Magic Eraser
Como fenologistas usam a edição de fotos com IA para monitoramento sazonal, normalização de fotografia repetida e estadiamento fenológico. Aprimore mudanças sutis de cor, remova desordem de campo e construa painéis de séries temporais.
SEO & Growth
Revisado por Magic Eraser Editorial ·
Índice
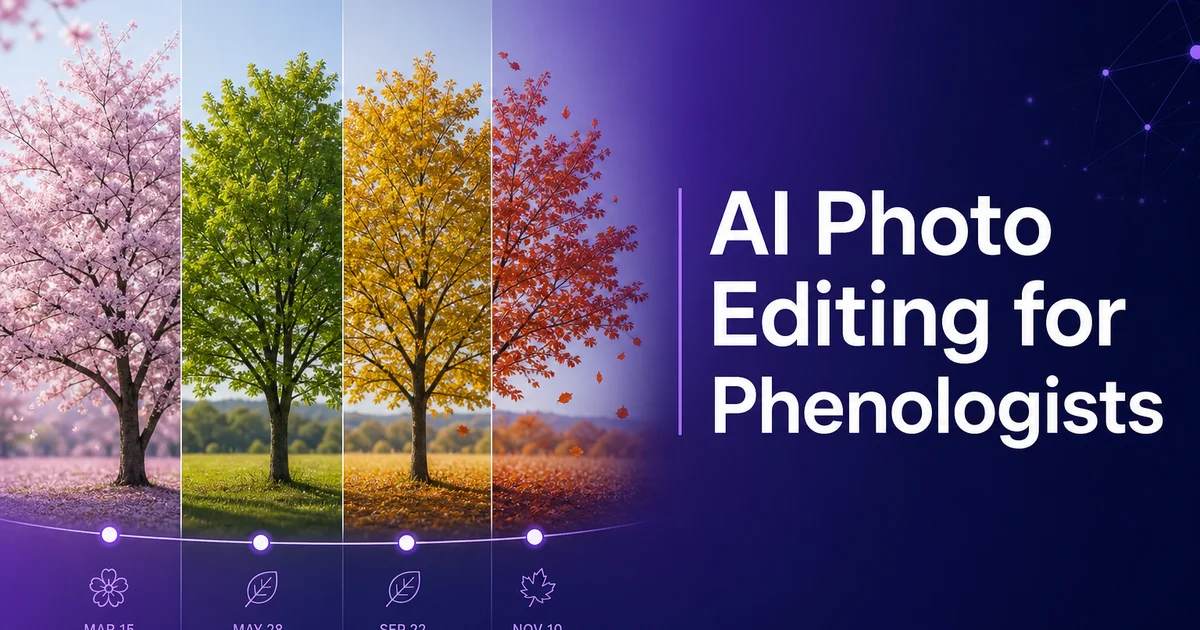
A fenologia — o estudo dos eventos biológicos recorrentes e de sua relação com o clima e a mudança sazonal — depende em seu núcleo de registros visuais. Quando uma cerejeira floresce, quando as aves migratórias chegam, quando as primeiras folhas de outono mudam de cor, quando o gelo se rompe em um lago. Esses eventos são registrados por meio de observação sistemática, e a fotografia tornou-se o principal meio desse registro. Redes fenológicas que abrangem continentes inteiros dependem de fotografias padronizadas enviadas por milhares de observadores para rastrear como o momento dos eventos sazonais está mudando em resposta às mudanças climáticas, fornecendo algumas das evidências mais acessíveis e robustas de um planeta em aquecimento.
As exigências fotográficas da fenologia são únicas entre as disciplinas científicas. O mesmo local deve ser fotografado repetidamente ao longo de semanas, meses e anos sob condições extremamente variáveis. Sol forte de verão, chuva nublada de outono, luz fraca de inverno, neve e lama de primavera. A informação cientificamente importante costuma ser uma mudança sutil de cor. O primeiro traço de verde em gemas marrons dormentes, a transição exata de verde para amarelo em uma copa de folhas senescentes, a data precisa em que mais de cinquenta por cento das flores de uma árvore amostral se abriram. Essas gradações sutis devem ser capturadas, preservadas e comparadas entre imagens de séries temporais tiradas sob condições inconsistentes de iluminação, clima e câmera.
As ferramentas de edição de fotos com IA enfrentam esses desafios normalizando as variáveis que mudam entre as sessões de observação, ao mesmo tempo que preservam os sinais fenológicos que os cientistas precisam medir. A correção de cor padroniza o balanço de branco entre imagens tiradas sob sol, nuvens, chuva e neve. O Boost aguça as finas gradações de cor que definem os estágios fenológicos. A remoção de fundo e a limpeza de objetos eliminam o ruído visual transitório. Caminhantes, equipamentos, estruturas temporárias — aquilo que muda entre as visitas e complica a análise comparativa. Para redes fenológicas que processam milhares de imagens anualmente, o pós-processamento eficiente assistido por IA está se tornando uma infraestrutura essencial.
- A normalização de cor entre as fotografias de séries temporais remove a variação de iluminação para que as mudanças aparentes reflitam as transições fenológicas reais.
- O aprimoramento com IA aguça as sutis gradações de cor de gemas, folhas e flores que definem os limiares de estadiamento fenológico.
- O Magic Eraser remove os elementos de campo transitórios — equipamentos, caminhantes, marcadores — sem afetar a vegetação ou o contexto ambiental.
- O processamento em lote padroniza séries fotográficas sazonais inteiras tiradas sob condições variáveis de clima, hora do dia e câmera.
- Painéis de séries temporais e figuras comparativas prontos para publicação a 300 DPI atendem aos requisitos das revistas para estudos fenológicos.
Normalização de fotografia repetida para monitoramento de longo prazo
O fundamento da fotografia fenológica é a fotografia repetida. Imagens tiradas da mesma posição fixa em intervalos regulares ao longo de períodos prolongados. A rede PhenoCam, por exemplo, opera mais de 700 câmeras automatizadas por toda a América do Norte que capturam imagens a cada trinta minutos durante o ano todo, gerando milhões de fotografias anualmente para análise fenológica em escala continental. Mesmo os programas manuais de monitoramento fenológico dependem de observadores que retornam às mesmas plantas etiquetadas e as fotografam a partir de posições consistentes em intervalos semanais ou quinzenais ao longo de toda a estação de crescimento.
O desafio da fotografia repetida é que as condições de iluminação nunca são as mesmas entre duas imagens quaisquer de uma série. Uma fotografia tirada às 10h de uma manhã ensolarada de julho parece muito diferente de uma tirada às 10h de uma tarde nublada de outubro. A temperatura de cor passa de amarelo quente para cinza-azulado frio, a exposição geral muda em vários pontos, e os padrões de sombra giram e se alongam. Se essas diferenças de iluminação não forem corrigidas, elas dominam o sinal fenológico real. Uma copa de folhas que parece ter mudado de verde para verde-amarelado pode estar simplesmente refletindo a mudança de temperatura de cor do sol para o céu nublado, e não uma mudança real na pigmentação das folhas.
A normalização de cor com IA resolve isso padronizando o balanço de branco, a exposição e a faixa tonal em séries temporais inteiras. Usando o cartão de referência de cor incluído em cada enquadramento (ou analisando superfícies de referência consistentes como cascas de árvore ou paredes de edifícios que não deveriam mudar de cor entre as visitas), a IA ajusta cada imagem a uma linha de base comum. A série corrigida mostra apenas mudanças reais na cor e na estrutura da vegetação, com a variação de iluminação removida. Essa normalização é especialmente crítica para os índices de verdor. Cálculos matemáticos do verdor da copa a partir dos canais de cor da imagem — que não têm sentido se as imagens de entrada não tiverem sido corrigidas para as condições de iluminação.
- A fotografia repetida gera imagens sob iluminação variável que podem mascarar ou imitar mudanças fenológicas reais sem normalização.
- A correção de balanço de branco com IA remove as mudanças de temperatura de cor entre sessões de captura ensolaradas, nubladas e de pouca luz.
- A normalização da exposição garante que as diferenças de brilho reflitam mudanças na densidade da copa, e não a variação da luz ambiente.
- Os cálculos do índice de verdor exigem entradas corrigidas em cor — imagens não normalizadas produzem métricas fenológicas quantitativas sem sentido.
Melhorando a precisão do estadiamento fenológico através do realce de detalhes com IA
O estadiamento fenológico — atribuir um estágio de desenvolvimento específico a uma planta em uma data de observação dada — exige distinguir entre estados visuais sutis que sempre transitam gradualmente de um para o outro. A amplamente usada escala BBCH para o desenvolvimento das plantas define dezenas de estágios com base na aparência morfológica: intumescimento das gemas, abertura das gemas, primeira folha desdobrada, folhas em tamanho pleno, primeira flor aberta, plena floração, primeiro fruto visível, fruto em tamanho pleno, início da coloração das folhas, cinquenta por cento de queda das folhas, e assim por diante. A diferença entre estágios adjacentes pode ser de alguns dias de desenvolvimento visíveis apenas como uma leve mudança no formato da gema, na cor da folha ou na porcentagem de abertura das flores.
As fotografias de campo padrão frequentemente carecem da resolução e do contraste para distinguir esses estágios adjacentes de forma confiável. Uma fotografia de uma copa de árvore tirada a uma distância de monitoramento de dez a vinte metros pode mostrar uma massa verde geral onde folhas e gemas individuais não são resolúveis. O boost de IA aumenta o contraste local e a nitidez para tornar folhas, gemas e flores individuais mais visíveis dentro de fotografias em escala de copa. Esse aprimoramento pode fazer a diferença entre estadiar uma copa como 'início da brotação foliar' versus 'folhas em plena expansão'. Estágios que podem estar separados por apenas uma semana, mas que têm implicações muito diferentes para os modelos de ecossistema que usam dados fenológicos como entrada.
Para fotografia de espécimes em primeiro plano, o boost de IA recupera as finas gradações de cor dentro de folhas e flores individuais que definem os subestágios. A transição do verde brilhante para o primeiro indício de amarelo em uma folha senescente, o momento exato em que uma flor que se abre expõe suas estruturas reprodutivas, a sutil mudança de cor quando um fruto começa a amadurecer. Essas são medidas em faixas estreitas do espectro de cores onde as câmeras padrão podem não capturar separação tonal suficiente. O processamento de IA que aumenta o contraste local dentro dessas faixas estreitas de cor torna o estadiamento mais preciso e mais consistente entre observadores diferentes, reduzindo a variabilidade interobservador que é uma fonte importante de ruído nos conjuntos de dados fenológicos.
- Os estágios fenológicos BBCH diferem por sutis mudanças morfológicas — formato da gema, expansão foliar, porcentagem de abertura das flores — que exigem detalhe de imagem nítido.
- O aprimoramento em escala de copa torna folhas e gemas individuais visíveis dentro de fotografias de monitoramento distantes para um estadiamento mais preciso.
- O aprimoramento das finas gradações de cor dentro de faixas espectrais estreitas melhora a detecção de transições precoces de senescência e amadurecimento.
- Um aprimoramento consistente entre observadores reduz a variabilidade de estadiamento interobservador, uma fonte importante de ruído nos conjuntos de dados fenológicos.
Limpeza de campo e visualização de séries temporais para publicações
Os locais de monitoramento fenológico acumulam desordem visual que muda entre as visitas de observação. Caminhantes atravessam os enquadramentos fixos das câmeras, equipamentos são movidos ou adicionados, estacas de neve e pluviômetros aparecem e desaparecem com as estações, e atividades de manutenção deixam vestígios temporários. Embora esse conteúdo transitório não afete os cálculos automatizados do índice de verdor (que analisam os valores de cor dos pixels em regiões de interesse definidas), ele impacta enormemente a qualidade visual das fotografias de séries temporais usadas em publicações, exposições e materiais de divulgação. Uma comparação lado a lado da brotação foliar primaveril ao longo de três anos é menos eficaz quando cada enquadramento contém diferentes artefatos humanos.
O Magic Eraser remove esses elementos transitórios enquanto mantém a vegetação, a superfície do solo e o contexto ambiental que constitui o registro fenológico. A restrição fundamental é que a remoção não deve alterar a informação fenológica. Remover um caminhante que obscurece parcialmente uma árvore monitorada não deve mudar a densidade ou a cor aparente da folhagem dessa árvore, e remover uma estaca de neve não deve alterar a profundidade aparente da neve. As ferramentas de remoção alimentadas por IA lidam com isso preenchendo de forma inteligente a área removida com conteúdo amostrado dos pixels circundantes, mantendo a continuidade visual do ambiente natural sem inventar dados fenológicos que não estavam na imagem original.
Para publicação e exibição, as séries temporais fenológicas são frequentemente exibidas como painéis de comparação que mostram os estágios-chave lado a lado ou como sequências animadas que comprimem meses de mudança em segundos. Essas visualizações exigem enquadramento, exposição e tratamento de cor consistentes em todos os enquadramentos da série. O fluxo de trabalho completo de IA — normalização, boost, limpeza — aplicado em lote a toda a série temporal produz painéis visualmente coerentes nos quais a atenção do espectador é atraída para as mudanças fenológicas em vez de distraída por mudanças de iluminação, desordem visual ou qualidade de imagem inconsistente entre os enquadramentos.
- A desordem de campo transitória — caminhantes, equipamentos, marcadores sazonais — muda entre as visitas e distrai da comparação fenológica.
- A remoção com IA preenche as lacunas com conteúdo apropriado ao ambiente, mantendo o contexto natural sem inventar dados fenológicos.
- Os painéis de comparação de séries temporais exigem enquadramento, cor e exposição consistentes que o processamento em lote com IA oferece em toda a série sazonal.
- As sequências fenológicas animadas se beneficiam de enquadramentos de origem normalizados e limpos que comprimem meses de mudança em narrativas visuais fluidas.
Programas de fenologia de ciência cidadã e padronização de imagens
O monitoramento fenológico em larga escala depende cada vez mais de redes de ciência cidadã nas quais milhares de observadores voluntários enviam fotografias de seus ambientes locais. Programas como o Nature's Notebook, a Rede Paneuropeia de Fenologia. O rastreamento da frente de florescimento das cerejeiras do Japão baseiam-se em fotografias tiradas por participantes com diversos níveis de habilidade fotográfica, equipamentos de câmera diferentes e sem controle sobre as condições de iluminação. A qualidade de imagem resultante varia de excelente a quase inutilizável. A padronização ao longo dessa diversidade é fundamental para que os dados tenham valor científico.
As ferramentas de edição de fotos com IA podem ser integradas aos fluxos de envio da ciência cidadã para normalizar automaticamente os problemas de qualidade mais comuns. A correção de balanço de branco compensa as imagens de tom quente tiradas ao sol do fim da tarde e as imagens de tom azul tiradas em dias nublados. A normalização da exposição traz as fotografias de sombra subexpostas e as imagens de pleno sol superexpostas para uma faixa de brilho comparável. A nitidez recupera o detalhe de fotografias de smartphone tiradas no limite de sua capacidade óptica. Essas correções podem ser aplicadas automaticamente no envio, criando um conjunto de dados mais consistente sem exigir que os participantes aprendam técnicas de pós-processamento.
Para os próprios cientistas cidadãos, as ferramentas de IA os ajudam a produzir fotografias melhores para seus próprios registros e para compartilhar com suas comunidades. Um voluntário que monitora uma macieira do quintal ao longo da estação de crescimento pode produzir painéis de séries temporais de qualidade de publicação que mostram da abertura das gemas à colheita, normalizados e limpos com as mesmas ferramentas que os pesquisadores especialistas usam. Essa melhoria de qualidade retroalimenta o engajamento. Os participantes que produzem resultados visuais robustos ficam mais motivados a continuar o monitoramento de longo prazo, enfrentando o desafio de retenção que limita muitos programas de ciência cidadã.
- As redes de fenologia de ciência cidadã recebem fotografias que abrangem amplas faixas de qualidade de participantes com equipamentos e habilidades variados.
- A normalização automatizada com IA no envio padroniza o balanço de branco, a exposição e a nitidez sem exigir habilidades de pós-processamento dos participantes.
- A melhoria da qualidade aumenta o engajamento e a retenção dos participantes, enfrentando uma limitação central dos programas de monitoramento de ciência cidadã de longo prazo.
- Os observadores voluntários podem produzir séries temporais sazonais de qualidade de publicação a partir do monitoramento do quintal usando as mesmas ferramentas de IA que os profissionais usam.
How to do it
- 1
Photograph phenological events with standardized framing and timing protocols
Set up a fixed camera position for repeat photography of your study site. The same vantage point, angle, and focal length for every observation period. Photograph at consistent times of day to minimize lighting variation between sessions. Include a color reference card and scale marker in the frame. For individual plant monitoring, photograph the same tagged specimen from the same distance and angle at each visit, capturing bud break, leaf-out, flowering, fruiting, and leaf senescence stages.
- 2
Remove distracting elements that obscure phenological features
Use Magic Eraser to remove trail markers, fencing, equipment tags, other researchers. Temporary field structures that appear in repeat photography frames. These transient elements change between visits and create visual noise that interferes with comparative analysis of phenological changes. Remove them without affecting the vegetation, soil surface, or environmental context that is scientifically relevant to the phenological record.
- 3
Enhance seasonal color and structural detail for phenological staging
Use AI Enhance to sharpen the subtle color and structural changes that define phenological stages. The first hint of green in swelling buds, the precise shade of emerging leaves versus mature foliage, the transition from green to senescent yellow-brown in autumn. These gradations are the core data in phenological photography. Boost that increases local contrast and color separation makes staging decisions more accurate and consistent across observers.
- 4
Normalize lighting and color across time-series photographs
Use AI color correction to normalize white balance, exposure. Overall brightness across photographs taken under different weather conditions, times of day, and seasons. Overcast November images and bright June images from the same fixed camera position should have comparable brightness and white balance so that apparent color changes reflect actual phenological transitions rather than lighting artifacts. Batch-process entire seasonal series for consistent normalization.
- 5
Prepare comparison panels and time-series visualizations
Arrange processed images from key phenological stages. Dormancy, bud break, full leaf-out, peak flowering, fruit set, senescence, and leaf drop — into standardized comparison panels with consistent dimensions, spacing, and date labels. Export at 300 DPI for publication. For displays and outreach, create animated sequences that compress an entire growing season into a smooth visual narrative showing vegetation change over weeks or months.
Fontes
- USA National Phenology Network: Observing Plants and Animals — USA National Phenology Network
- Repeated Photography Methods for Tracking Vegetation Phenology — Springer Nature
- PhenoCam Network: Continental-Scale Phenological Monitoring — Northern Arizona University